Data Lab · June 20, 2026 · 8 minute read
The short version
In a simultaneous road test, an EK1 Pro multi-channel enhanced-PID log delivered about 3.14 samples per second for each channel. KDMLink captured the car's broadcast CAN data at up to 72 samples per second per signal.
That makes KDMLink's RPM, accelerator, throttle, speed, and intake-temperature data roughly 23 times denser in this test. The difference matters whenever the analysis depends on how quickly a value changes: virtual dyno curves, acceleration timing, DCT shifts, boost response, and synchronized cross-channel plots.
What this comparison measures:
This is a comparison of the tested EK1 Pro multi-channel diagnostic logging configuration against KDMLink's direct CAN capture. It is not a claim about every possible EK1 Pro mode or the maximum throughput of its hardware.
Two different ways to get data from the car
The rate difference starts with how each log was collected.
| EK1 Pro multi-channel log | KDMLink direct CAN capture | |
|---|---|---|
| Method | Request an enhanced PID and wait for the ECU response | Listen to frames the vehicle already broadcasts |
| Measured per-channel rate | About 3.14 Hz | Up to 72.3 Hz |
| Adding channels | Shares the request/response budget | Broadcast signals continue arriving independently |
| Timing | Channels are read at different points in the polling cycle | Every received frame is timestamped on the same clock |
Diagnostic logging is a conversation. The logger requests one value, waits for the ECU to reply, and moves to the next value. With several channels selected, it cycles through them. Each individual channel therefore updates less often.
KDMLink listens to the powertrain CAN bus instead. RPM, pedal position, throttle, vehicle speed, and other values are already being broadcast for the vehicle's control modules. KDMLink does not need to request those values one at a time; it captures each frame as it arrives.
What we measured
Both logs came from the same drive and were recorded simultaneously. The KDMLink capture ran for about 55 seconds and contained 127,835 CAN frames. The EK1 Pro reference log contained 191 samples per selected channel over roughly 61 seconds.
| Signal | CAN ID | KDMLink | EK1 Pro | Measured advantage |
|---|---|---|---|---|
| Engine RPM | 0x080 | 72.3 Hz | 3.14 Hz | 23× |
| Accelerator pedal | 0x080 | 72.3 Hz | 3.14 Hz | 23× |
| Throttle position | 0x329 | 72.0 Hz | 3.14 Hz | 23× |
| Vehicle speed | 0x316 | 71.9 Hz | 3.14 Hz | 23× |
| Intake air temperature | 0x081 | 71.7 Hz | 3.14 Hz | 23× |
| Wheel speed | 0x386 | 35.9 Hz | 3.14 Hz | 11× |
| Boost pressure | 0x492 | 14.5 Hz | 3.14 Hz | 4.6× |
The exact KDMLink rate depends on how often the vehicle broadcasts each CAN ID. The important part is that capturing one broadcast signal does not require KDMLink to pause the others.
One pull, two very different traces
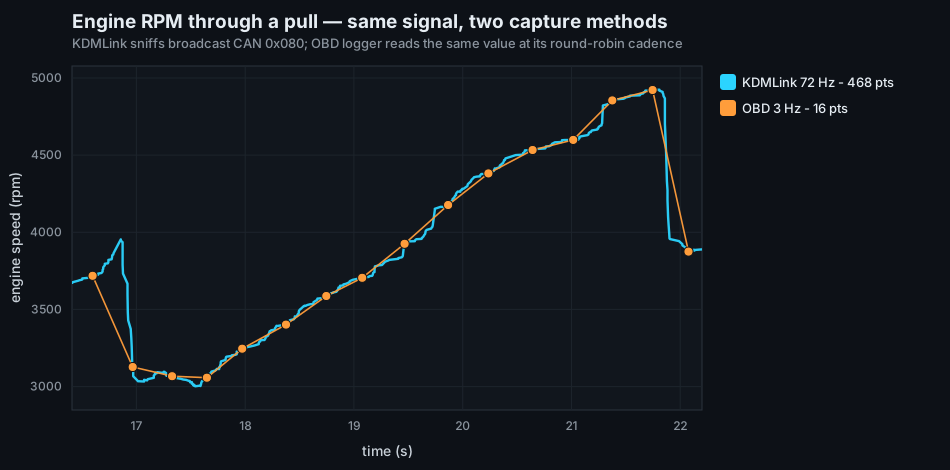
This 5.8-second window contains 468 KDMLink RPM points and 16 points at the EK1 Pro cadence. Both traces describe the same pull, but they do not preserve the same information. The dense trace resolves the launch, the RPM climb, and the sharp drop during the shift. The sparse trace connects widely separated samples and rounds over fast transitions.
A DCT shift can happen between two samples
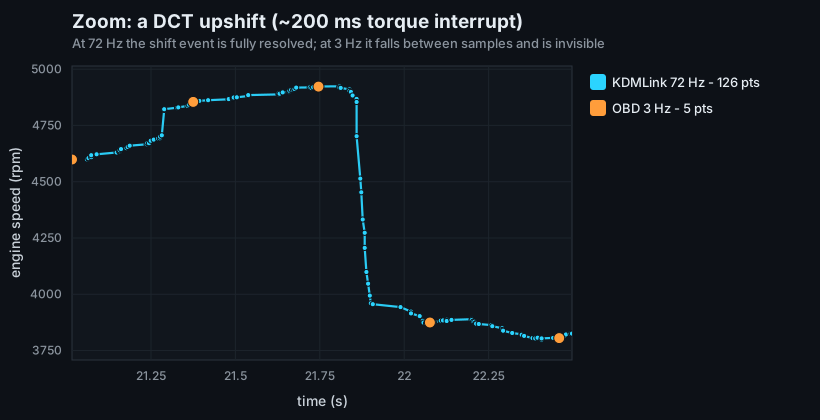
During this shift, engine speed dropped by about 970 RPM in roughly 150 milliseconds. KDMLink captured approximately 18 frames during the event. At 3.14 Hz, samples arrive about 318 milliseconds apart, so the entire torque interruption can fit between two RPM readings.
That resolution is useful for:
- Finding the exact start and end of a shift
- Separating a clean single-gear pull for dyno analysis
- Inspecting clutch slip or RPM flare
- Comparing torque intervention between shifts
Why virtual dyno needs a high-rate RPM trace
A virtual dyno estimates power from the rate at which the engine accelerates. In simplified form:
power ∝ ω × (dω/dt)

where ω = engine speed in radians per second = 2π × RPM / 60
The critical term is dω/dt, the change in engine speed over time. Differentiation amplifies
noise, so a useful calculation needs enough samples to filter noise without erasing the shape
of the pull.
A four-second pull at 3 Hz provides only about 12 RPM points. At 72 Hz, the same pull provides nearly 290. That additional data creates room to smooth noise while retaining torque peaks, power roll-off, and shift boundaries.
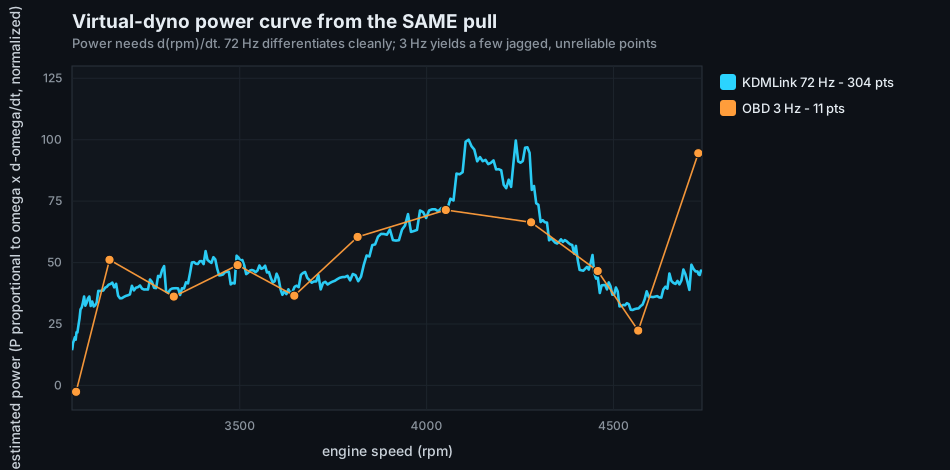
For this pull, the 72 Hz calculation produces a continuous curve with a clear peak around 4,050–4,250 RPM. The 3 Hz version misses much of that peak and produces an artificial spike near the top of the run. Those are sampling artifacts, not changes in the engine.
About the power axis:
The chart is normalized to compare curve shape. Absolute wheel horsepower also requires vehicle mass, gear ratio, tire size, and a drag and driveline-loss model.
Boost benefits too
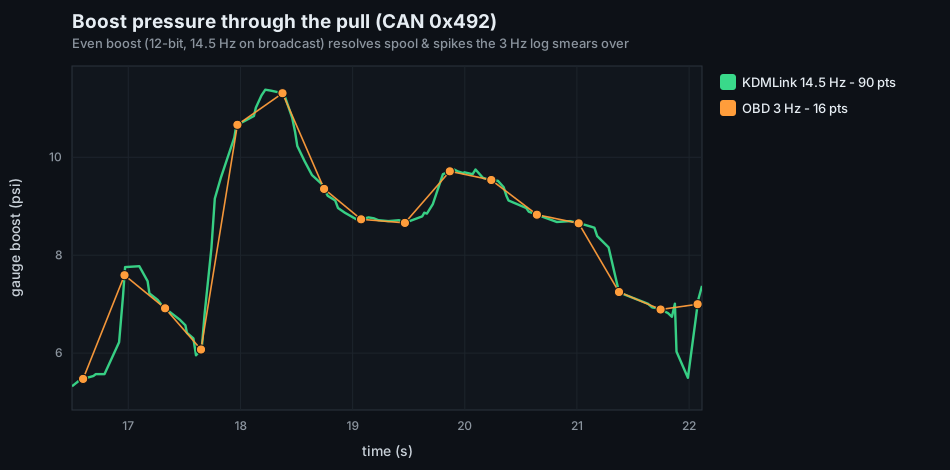
Boost is broadcast less often than RPM on this vehicle, but KDMLink still captured it at about 14.5 Hz—roughly 4.6 times the tested EK1 Pro per-channel rate. The denser trace preserves the spool ramp and a brief pressure dip during the shift that the slower cadence smooths over.
For diagnosing an overboost event, wastegate response, or a shift-related pressure drop, the short event between samples may be the event you needed to see.
Synchronization matters as much as speed
In a request-and-response log, channels are polled one after another. The RPM, throttle, and boost values shown on the same row may have been measured at different moments in the polling cycle. During a launch or shift, a few hundred milliseconds of offset can change the meaning of a cross-channel comparison.
KDMLink timestamps each received broadcast frame against one clock. The CAN IDs do not all broadcast at the same frequency, but their timestamps share the same time base. That produces more honest RPM-versus-throttle, boost-versus-RPM, and speed-versus-time analysis.
Where EK1 Pro diagnostic polling still matters
Direct CAN capture is not a replacement for every diagnostic PID. Some values are not broadcast on this vehicle's bus and must be requested from the ECU. Examples include AFR, ignition timing, knock, and fuel-rail pressure.
An EK1 Pro can also return a single requested PID faster when fewer channels are selected. The tradeoff is channel coverage: spending more of the request budget on one PID leaves less time for the rest.
The practical distinction is:
- Use diagnostic requests for values the car does not broadcast.
- Use KDMLink's direct CAN capture when timing resolution and synchronization are central to the result.
The takeaway
EK1 Pro and KDMLink are not simply two interfaces reading the same data in the same way. In the tested setup, the EK1 Pro log requested multiple enhanced PIDs in sequence, while KDMLink captured the vehicle's existing CAN broadcasts in parallel.
For steady-state checks, a few readings per second may be enough. For a virtual dyno, an acceleration timer, a DCT shift, or boost-spool analysis, it is not. KDMLink's direct capture preserves the fast changes that make those measurements useful.
Test methodology
- Both files came from the same drive and were recorded simultaneously.
- The clocks were aligned by cross-correlating accelerator pedal and throttle. Correlation was 0.994 for pedal and 0.997 for throttle after applying a 400 ms offset.
- The EK1 Pro cadence came from its actual sample timestamps: 191 samples per channel over approximately 61 seconds.
- KDMLink rates are frame counts divided by the 55-second capture duration.
- The cadence comparison sampled the broadcast RPM at the EK1 Pro timestamps, isolating the effect of sampling rate from differences in signal decoding.